Tampa Bay homeowner guide
Calculator + decision guideFind a possible hidden leak and estimate the water loss
Unexpected water use, staining, dampness, musty odors, or sounds of water when fixtures are off can justify investigation, but no single sign proves where a leak is. Compare usage, make a no-water meter check when it is safe and permitted, and call for leak detection when the source remains hidden or damage is developing.
Free water-loss calculatorEstimate the water loss before you read the full guide.Choose counted drips, a safe measured flow, or a known daily amount. The calculator shows the assumptions and keeps your entries in this browser only.Jump to calculatorOn this page
The short answer
What to do first
A higher bill, meter movement, moisture, sound, staining, or repeated pressure change can justify a leak investigation, but no single clue proves the source. First rule out active water use, record a repeatable pattern, and stop if electricity, wastewater, structure, ceiling collapse, or another hazard is involved. The calculator below accepts counted drips, a safely collected flow, or a known daily loss; it shows every major assumption and never diagnoses the source or predicts an exact bill.
Transparent planning calculator
Estimate water loss three different ways.
Count drips, time a safe collected flow, or enter a known daily loss. Nothing is saved. This is transparent planning arithmetic—not a leak diagnosis or a utility bill prediction.
Five things to remember
- Treat clues as evidence, not a diagnosis.
- Use a controlled meter observation only when every known water use can be stopped safely.
- Compare dated bills using gallons, days in the billing period, occupancy, irrigation, and utility notices.
- Estimate loss from counted drips, a measured flow, or a known daily amount; use the current rate for the actual serving utility.
- Escalate promptly for active damage, wastewater, structural change, or water near electricity.
Print the leak observation worksheet
Record meter observations, bills, symptoms, fixture checks, and professional findings without storing account credentials.
Choose the first route from the condition—not the theory
Leave the area and use emergency or utility help
Do not cross the hazard to reach a valve or collect a reading.
Use only a known private control
Do not force a valve; record what was shut off and arrange urgent assessment.
Create a controlled observation record
Use dates, gallons, occupancy, irrigation, fixtures, and repeat readings.
Contact the serving utility first
Record the incident number and instructions before arranging private work.
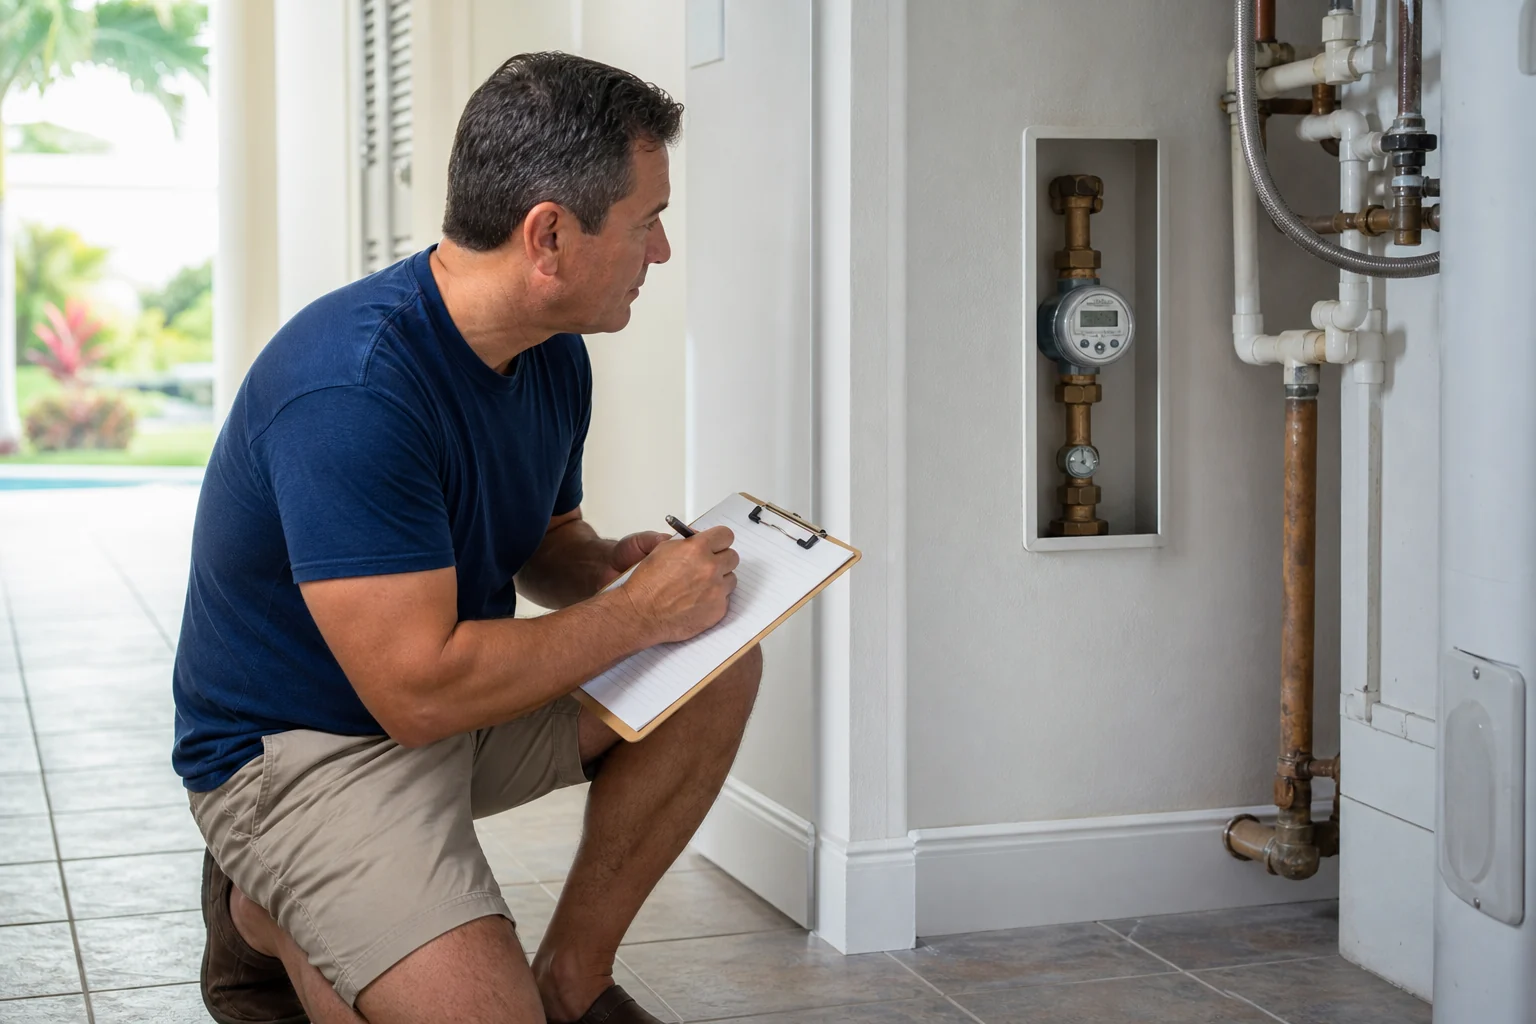
Run a safe, repeatable meter observation
Before
- Confirm no immediate hazard and do not access a flooded, locked, traffic, or utility-only area
- Pause known indoor, irrigation, pool, treatment, and appliance water use if safe
- Photograph the display and note date, time, occupants, weather, and known automatic equipment
Observe
- Do not dismantle or operate the meter
- Record the same displayed units at the start and after a chosen interval
- Repeat only under comparable conditions if the result is unclear
After
- Restore normal equipment and schedules
- Compare the record with bills and visible symptoms
- Share observations without claiming they prove the source
What common clues can—and cannot—tell you
Swipe sideways to see every column| Clue | Useful follow-up | Do not conclude |
|---|---|---|
| Higher water use | Compare gallons, billing days, occupancy, irrigation, pools, guests, and utility notices | That a hidden plumbing leak is the only cause |
| Meter changes with known uses stopped | Repeat the controlled observation and note automatic systems | Where the water is going |
| Stain, odor, sound, or dampness | Photograph safely, note timing, weather, nearby fixtures, and HVAC use | That the nearest pipe is responsible |
| Hot-water or energy change | Record water-heater operation, demand, and visible discharge | That the tank must be replaced |
| Low pressure | Use the one-fixture/hot-only/whole-property decision tree | That a leak is present |
Turn observations into a useful service record
Describe the pattern
What changed, where, when, how often, and which fixtures or systems are involved?
Share evidence
Provide safe photos, bill gallons, meter observations, utility notices, and previous repairs.
Ask for the assessment boundary
Which system was checked, what evidence supports the finding, and what remains untested?
Keep the written result
Save the diagnosis, scope, exclusions, approvals, repair record, and follow-up test.
Calculator formulas and interpretation
Swipe sideways to see every column| Input or result | Formula | Boundary |
|---|---|---|
| Counted-drip flow | Drips/minute × mL/drop × fixtures ÷ 3,785.411784 | Drop size varies; the default is editable |
| Measured flow | Collected gallons ÷ measured minutes × similar fixtures | Collect only from a safe, known outlet |
| Known daily loss | User-entered daily volume | The source estimate controls accuracy |
| Daily volume | Gallons per minute × 60 × active hours | Assumes the entered pattern continues for those hours |
| Monthly volume | Daily volume × 30.4375 | Planning estimate, not a billing-period prediction |
| Annual volume | Daily volume × 365 | Planning estimate, not proof of a yearlong leak |
| Optional cost | Volume ÷ 1,000 × user-entered combined rate | Excludes tiers and all unentered charges |
Use the utility's current rate information for the exact account and treat the result as an estimate only.
Use the serving utility—not a generic Tampa Bay rate
Swipe sideways to see every column| Need | Official starting point | What to save |
|---|---|---|
| Check the City of Tampa meter process | City of Tampa leak guidance | Meter number, dated display photos, and observation conditions |
| Enter a current City of Tampa rate | Current rate schedules | The exact water/sewer rate elements that apply to the account |
| Ask about a repaired-leak adjustment | City of Tampa adjustment form | Repair invoice, dates, usage period, and requested documentation |
| Property served by another utility | Use the provider named on the current bill | Provider instructions, incident/reference number, and current rate page |
Eligibility, evidence, rates, and adjustment rules can change. Check the serving utility's current instructions before relying on them.
Why the drop-size assumption is editable
The USGS consumer calculator uses 0.25 milliliters per drip while also warning that there is no scientific definition of one faucet drip. Shape, opening, fluid, and flow conditions change the drop. Keep 0.25 mL for a comparable planning estimate or replace it with a defensible measured assumption; do not present the result as measured loss unless it was actually measured.
Stop observing and call when delay can increase harm
Prompt professional assessment is appropriate for active water, recurring ceiling or wall moisture, suspected slab or underground loss, unexplained continuous flow, wastewater, loss of essential service, or a pattern that returns after a repair.
- Call 911 for immediate life safety danger.
- Call the serving utility for public-service or meter-side concerns.
- Notify the building, association, landlord, or manager when access or shared systems may be involved.
Related next steps
Use the guide that matches the situation.
How this resource was made
Methodology and limits
This guide combines EPA WaterSense and City of Tampa leak-check guidance with transparent arithmetic. The calculator supports counted drips, a safely measured collected flow, or a known daily amount; visitors control the drop-volume, fixture-count, daily-hours, and optional rate assumptions.
- A meter observation or calculator result cannot locate or classify a leak.
- The 0.25 mL default is a planning convention used by the USGS calculator, not a scientific universal drop size.
- Tiered utility rates, sewer charges, fixed fees, taxes, credits, and billing periods differ.
- Shared meters, irrigation, pools, treatment equipment, and intermittent devices can complicate the pattern.
- Only an onsite professional or responsible utility can assess the actual system.
Sources
Reviewed sources
- Home Maintenance: LeaksU.S. Environmental Protection Agency · Reviewed 8/27/2026
- WaterSenseU.S. Environmental Protection Agency · Reviewed 8/17/2026
- Water FAQsPinellas County · Reviewed 8/17/2026
- Leak Detection and Flow Monitoring DevicesU.S. Environmental Protection Agency · Reviewed 8/27/2026
- How the WaterSense Calculator WorksU.S. Environmental Protection Agency · Reviewed 8/27/2026
- Check for LeaksCity of Tampa Water Department · Reviewed 8/27/2026
- Utility Rates, Deposits and FeesCity of Tampa Utilities · Reviewed 8/28/2026
- Water Leak Adjustment RequestCity of Tampa Utilities · Reviewed 8/28/2026
- Drip CalculatorU.S. Geological Survey · Reviewed 8/28/2026
Reviewed by Plumbers in Tampa Bay on 8/28/2026.